Platform
Data Visualization Platform
Part art, part science, big data visualization combines software, statistics, and science through storytelling. When told well, these stories have the power to illuminate, inspire, and most importantly, lead to new biologic and therapeutic insights.
Share:

 Together, BBI and the Fred Hutch have created the Data Visualization Center, infusing collaborating labs with data visualization, engineering, and data science resources. In addition to accelerating research, these engagements expose researchers to new approaches, technologies, and people - strengthening the broader research community in the Seattle area. Learn more here >.
About the Platform: Michael Zager, Director, Fred Hutch-BBI Data Visualization Center Michael Zager
 Learn about what makes Michael Zager and the BBI Data Visualization Center unique >
Explore a few of BBI's collaborations with the Data Visualization Center:
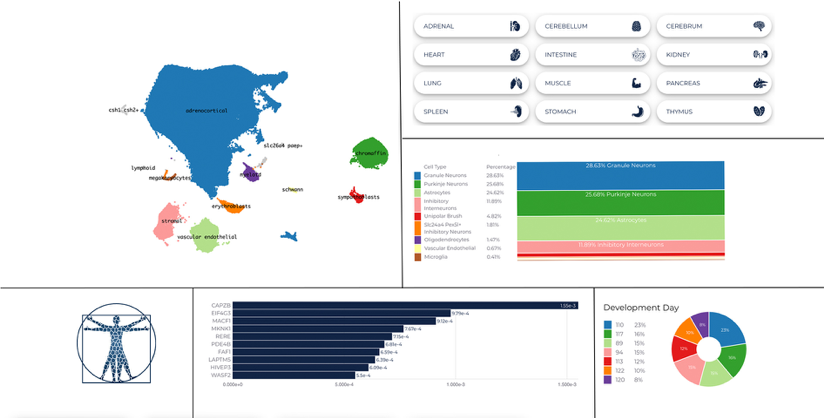
ATLAS OF GENE EXPRESSION DURING DEVELOPMENT
ATLAS OF CHROMATIN ACCESSIBILITY DURING DEVELOPMENT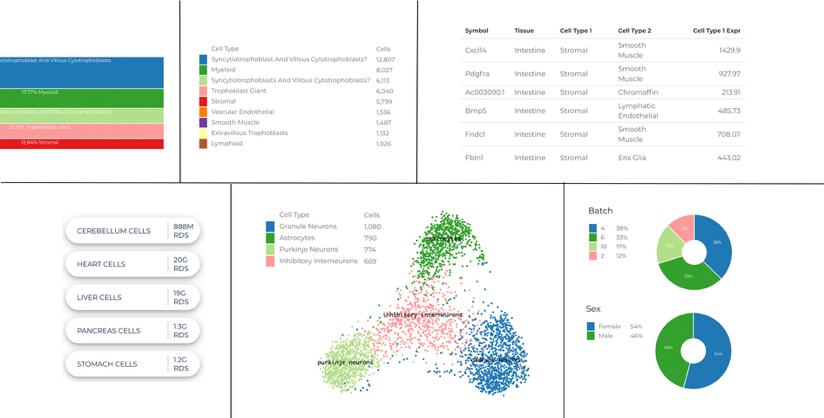
Platform Contact
https://viz.fredhutch.org/contact/